David Davila-Garcia, Yash Potdar, Marco Morocho
Advisor: Dr. Albert Hsiao

View Poster
Motivation
Pulmonary edema is a serious and potentially life-threatening condition caused by increased extravascular lung water. Cardiogenic pulmonary edema (CPE) results from increased blood pressure and is a result of heart failure.
Current methods of diagnosis for CPE depend on radiologists manually examining X-ray images. Manual examination is time-consuming and may not be a luxury that patients can afford to wait on. Moreover, manual work done by radiologists is not 100% accurate, leaving room for human error. A highly accurate neural network has the potential to help individuals with CPE receive necessary treatment in a timely manner, particularly in low and middle-income countries where there may not be enough radiologists to interpret chest X-rays.
Project Overview
Convolutional neural networks (CNNs) have been effective in classifying diseases from medical images. In this project, we aim to build upon the methods used by Justin Huynh in “Deep Learning Radiographic Assessment of Pulmonary Edema”. This paper demonstrated the potential of CNNs in diagnosing CPE by training them on chest radiographs and NT-proBNP, a clinical biomarker measured from blood serum. In this study, we examine the effects of the addition of clinical data and image segmentation. We believe the addition of the following can improve the accuracy of a CNN classifier of CPE:
-
Clinical data: Recent literature suggests that NT-proBNP concentrations can be influenced by confounding factors such as renal failure, age, sex, and body mass index (BMI). Thus, we will train the model with confounding clinical data of BMI, creatinine level, and presence of pneumonia and acute heart failure to correctly distinguish normal and edema cases.
-
Lung and Heart Segmentation: We will use transfer learning with an image segmentation model to isolate the heart and lungs of an X-ray image. We believe this reduces noise and focuses the network on the regions where edema would reside.
Data
We constructed a dataset of 16,619 records from UC San Diego (UCSD) Health patients. The dataset initially provided by the UCSD Artificial Intelligence and Data Analytics (AIDA) Lab had 18,900 records, but we dropped rows with missing clinical data. We also removed the unique identifiers for patients.
| NTproBNP | log10_NTproBNP | bmi | creatinine | pneumonia | acute_heart_failure | cardiogenic_edema |
|---|---|---|---|---|---|---|
| 418 | 2.62118 | 25.51 | 0.61 | 1 | 0 | 1 |
| 2161 | 3.33465 | 31.38 | 1.31 | 0 | 0 | 1 |
| 118 | 2.07188 | 33.81 | 0.66 | 0 | 0 | 0 |
| 49.9 | 1.6981 | 30.64 | 0.64 | 0 | 0 | 0 |
| 20029 | 4.30166 | 34.81 | 10.54 | 0 | 0 | 1 |
The NT-proBNP column represents the NT-proBNP value, a continuously valued biomarker measured from blood serum samples. As seen in the distribution below, there is a strong right skew due to the abnormally high NT-proBNP values. We performed a log transformation to create the log10_NTproBNP column. Using the threshold for pulmonary edema established in Huynh’s paper and prior work, we classified any patient with an NT-proBNP value of at least $400 pg/mL$ as an edema case. Any records with a log NT-proBNP value of at least $2.602$ ($log_{10} 400$) are considered edema cases.
The bmi column contained the body mass index ($kg/m^2$) of the patient, which is derived from a patient’s mass and height. The ‘creatinine’ column contains a continuous value of creatinine level ($mg/dL$) measured from blood serum samples. The pneumonia and acute_heart_failure columns contain binary values and are 1 if a patient has the condition. In the dataset, 12.0% of patients have pneumonia and 17.2% have acute heart failure. The distributions of the quantitative features are shown below.
The target column (cardiogenic_edema) contains binary values which are 1 if a patient has CPE. Around 64.7% of the records in our dataset had CPE based on the threshold.
Methods
We trained four modified ResNet152 CNN architectures with differing inputs:
- Original Radiographs only
- Original Radiographs + Clinical Data
- Original Radiographs + Heart & Lung Segmentations
- Original Radiographs + Heart & Lung Segmentations + Clinical Data
The data were randomly split into train, validation, and test sets at a ratio of 80%/10%/10%. The four model’s accuracy and AUC on the test set (n = 1,662) were used to compare model performance.
Input: Clinical Data
To ensure high-quality data for our project, we excluded patients with missing values for columns containing clinical data, specifically BMI, creatinine, pneumonia, and acute heart failure. These values which have been identified as confounds for CPE would be appended to the feature vector within the ResNet152 CNN.
Input: Lung & Heart Image Segmentation
The UCSD AIDA laboratory provided us with a pre-trained U-Net CNN, which creates predicted binary masks of the right and left lungs, heart, right and left clavicle, and spinal column for each patient’s X-ray. A left lung mask, as seen in the diagram below, has a value of 1 for pixels representing part of the left lung, and 0 otherwise. Masks can be combined using an OR operation, which yields a value of 1 when either mask has a value of 1, and 0 otherwise. In order to segment an image, we would simply multiply the binary mask to the image, which would yield an image with pixels corresponding to the 1’s in a mask.
In our segmentation process, we applied the pre-trained model to the full dataset of X-rays. We then used the binary masks to create two segmented images of the lungs and heart. The segmentation process is visualized in the following figure, where we begin with the original radiograph, generate masks of the lungs and heart regions, and apply it over the radiograph to isolate the lungs and heart.
Model Architectures
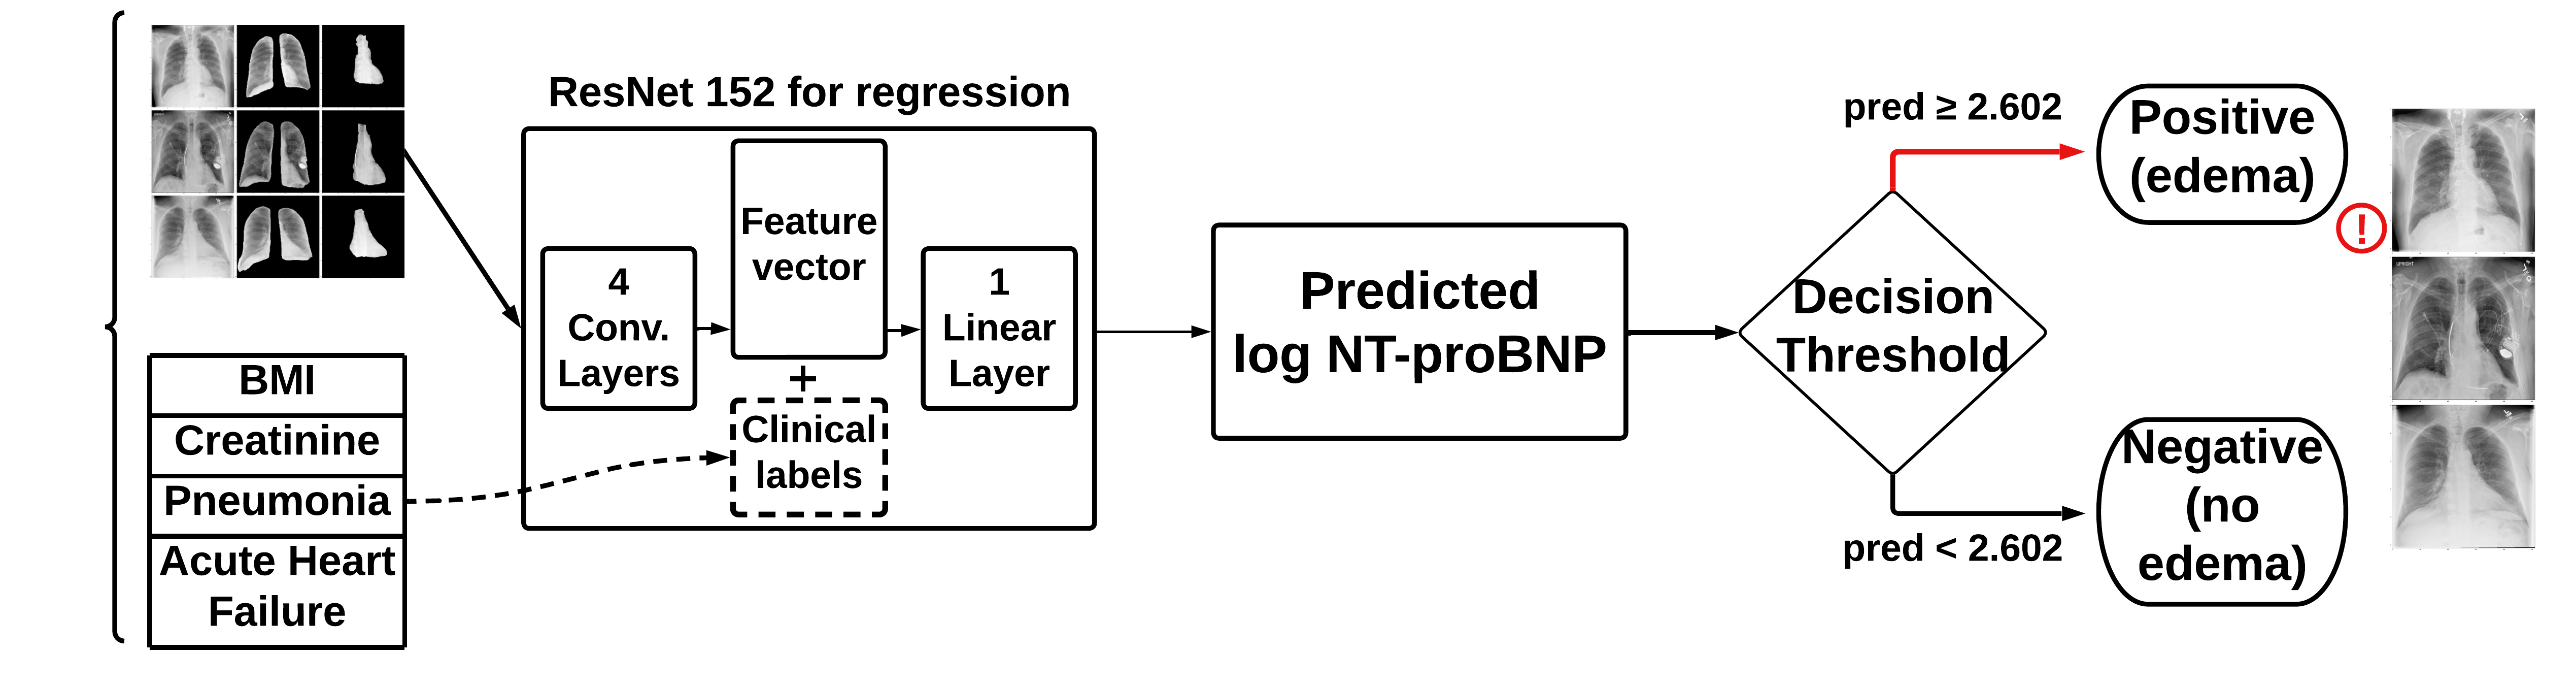
We used the default PyTorch ResNet152 model with a regression output since we were predicting log10_NTproBNP values. By using the classification threshold for log10_NTproBNP of 2.602, we were able to make a classification output. The four architectures, which differ by their inputs, are shown below:
- Model A: original X-rays
- Model B: original X-rays + clinical data
- Concatenates the clinical data with the output from the convolutional layers
- Model C: original X-rays + lung segmentations + heart segmentations
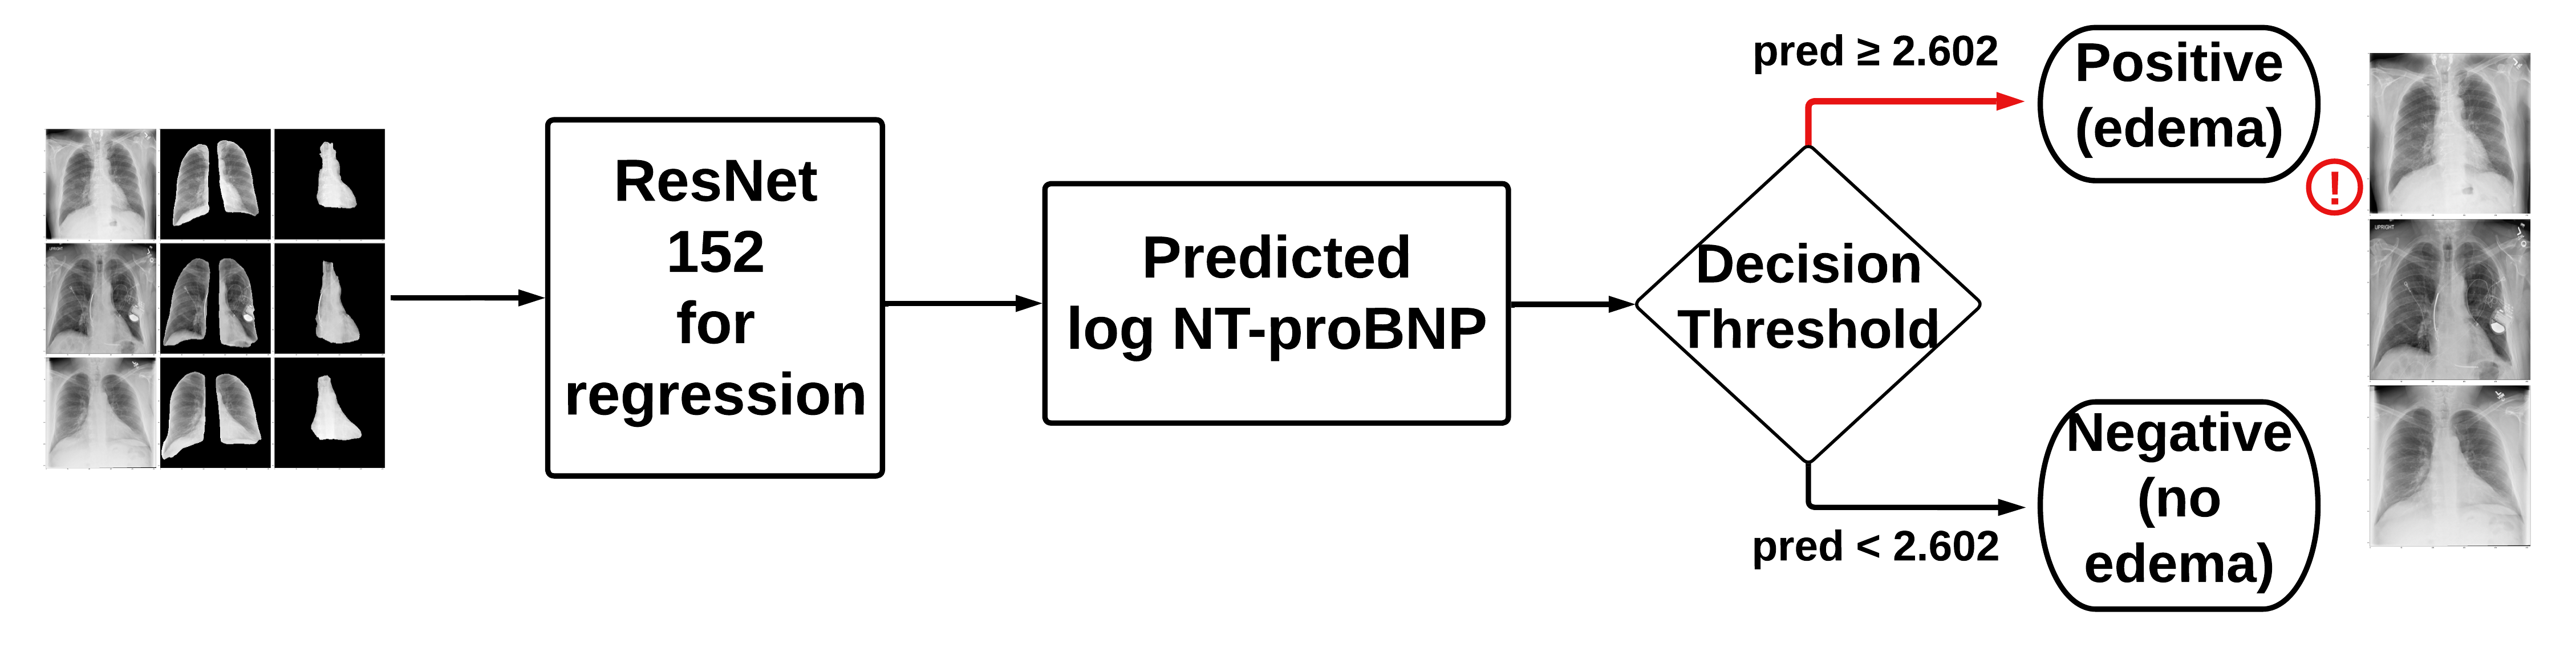
- Model D: original X-rays + lung segmentations + heart segmentations + clinical data
- Concatenates the clinical data with the output from the convolutional layers
Model Training & Testing
All four models were trained on the training set for 20 epochs using the Nadam optimizer with a learning rate of 0.001, and the mean absolute error (MAE) was used as the loss function to evaluate the neural network. The MAE on the validation set was computed after each epoch, and early stopping was implemented such that the model with the minimum MAE on the validation set was saved. After 20 epochs, the MAE on the unseen test set was computed for the four models with the minimum MAE on the validation set. We saved the predicted log10_NTproBNP values for each patient in the test set and compared these to the laboratory-measured values to evaluate our models.
Findings
In order to evaluate our models, we compared how the predicted log10_NTproBNP compared to the laboratory-measured log10_NTproBNP values. We did this by plotting predictions against true values and calculating the Pearson correlation coefficient. We also used the threshold for CPE to binarize each model’s predicted values of log10_NTproBNP and calculate accuracy and Area under the ROC Curve (AUC).
The table below exhibits the ResNet152 model performances by input data, including their respective Train L1-Loss, Test L1-Loss, Accuracy, AUC, and Pearson R scores, highlighting that Model (B) performed the best with an accuracy of 0.787 and AUC of 0.869. It is noteworthy that Model (D) performed marginally worse than Model (B). Therefore, the results suggest that incorporating clinical data positively impacted the ResNet152 model’s performance to identify cases of CPE, but the addition of heart and lung segmentation did not.

AUC-ROC Comparison
The AUC-ROC Curves below displays the ROC curves of each ResNet152 model by Input Data. ROC curves display the performance of a binary classifier at multiple thresholds, and better classifiers will have more area under the curve. It can be seen that both Model B and Model D performed better than Model A and Model C since they have greater areas under the curve. Model B achieved the highest AUC score of 0.869 among all models.
Pearson R Correlation Comparison
The performance of the models can also be seen in the Pearson correlation scatterplots. These plots represent how well the predicted log10_NTproBNP correspond to the actual log10_NTproBNP values. Where the red line of $y=x$ represents a perfect model, it can be seen that both Models B and D best follow that line, with correlations of 0.739 and 0.738, respectively. Although there is not a significant difference in the correlation coefficient between these two models, they outperform the other two models.
Confusion Matrices
The Confusion Matrices show the predicted labels and true labels for each model on the test set. As previously mentioned, the matrices showcase that Model B outperformed Model A (AUC of 0.824) and even Model D (AUC of 0.866), which incorporated all the original chest radiographs, clinical data inputs, and lung and heart segmentation.
Accuracy is an important consideration, but we would also want to minimize False Negatives, which mean we classified an edema case incorrectly as a normal case. Since it is potentially deadly to miss a positive diagnosis, we would want to minimize the False Negative Rate (FNR), which may increase False Positives. It can be seen that Model D minimizes the FNR with a value of 0.072, whereas Model C has the second lowest FNR. This suggests that segmentation may be lead to a classifier that predicts edema more often. The models utilizing segmentation each predicted 71% of the test set as having edema, compared to 69% for Model B.
Takeaways
From our results above, it is apparent that a more complex and preprocessed input did not improve the ability of the classifier to identify cases of pulmonary edema. We had hypothesized that image segmentation of X-rays would help focus the neural network on the lungs and heart regions, which is where edema occurs. We believed by reducing noise in the input, the classifier would be able to better distinguish normal and edema cases. However, segmentation did not improve performance. We propose two possible reasons for these findings:
-
The neural network already focuses on the relevant regions of the X-rays where edema occurs. Due to this, providing segmented images is not necessarily adding information to the ResNet152 model, but is instead cropping information out when it is passed to the network.
-
The dataset size may have been sufficient for the neural network to distinguish normal and edema cases without the need for segmentation. With around 13,000 training images, there was enough data for the neural network to learn the features that distinguish normal and edema cases in the lung and heart regions. A smaller dataset may benefit from segmentation as it provides more focused input and could help the neural network to learn the relevant features more accurately. Segmentation may yield a better classifier, in this case, due to the lack of the neural network’s ability to have enough data to focus on the heart and lungs.
Our results reinforce our hypothesis that the addition of confounding factors as features improve the performance of a classifier. This suggests that when creating a classifier, it is crucial to understand the features that truly correlate with the target feature. In this case, the clinical labels have shown that they have a high impact on the presence of CPE.
We were also able to create a model that performed better than the model in Huynh’s paper trained on 256x256 images. The AUC obtained by the model in the paper was roughly 0.85, whereas our highest-performing model had an AUC of 0.869.
Overall, while we had expected segmentation to improve the classifier’s accuracy, our results suggest that it may not always be necessary or beneficial depending on the dataset size and the neural network’s ability to learn relevant features.
Conclusion
This project demonstrates the relevance of considering confounding factors, clinical data, and image segmentation when training CNN models to diagnose CPE from chest radiographs. This project potentially has a strong impact because a highly accurate neural network can diagnose cases of CPE before symptoms worsen, allowing individuals to undergo early treatment. This could increase equity and allow individuals with reduced access to healthcare receive timely diagnoses. While an increase in CNN model performance was observed from adding clinical data, no such change was observed from heart and lung segmentation. Further research is needed to determine the optimal use of image segmentation in CNN models.
Acknowledgments
We would like to thank our mentor, Dr. Albert Hsiao, for his guidance and feedback throughout the duration of this project. We would also like to thank Amin Mahmoodi in the UCSD AIDA lab for sharing the lung and heart segmentation network with us. Finally, we would like to thank our fellow students in our capstone section who we were able to learn from and collaborate with throughout the last six months.
About Us
| David Davila-Garcia | Yash Potdar | Marco Morocho |
 |
 |
 |
| David is from Saint Louis, MO. After graduation, he plans to pursue a MS in Biomedical Informatics and MD. | Yash is from the SF Bay Area. After graduation, he plans to travel Europe and work in the tech space. Some fields he is interested in pursuing are autonomous vehicles and consumer technology. | Marco is from Los Angeles, CA. After college, he plans to travel and eventually get into the Sports Analytics field. |